Instituto Brasileiro de Geografia e Estatística
IBGE has a complex database. It is composed of several researches responsible for measuring a set of aggregates which has several variables, locations and classifications associated with it.
An aggregate is also commonly referred to as a IBGE table.
Some aggregates may be filtered by locations such as cities, states, mesoregions, microregions and macroregions, as well by classifications and categories.
For example, IPCA, the inflation rate, is an aggregate of the research “Índice Nacional de Preços ao Consumidor Amplo”, with variables such as monthly and cumulative variation. It has values for every Brazil’s location and for various kinds of products.
To show how to use the package, we will try to replicate these visualizations on the most recent IPCA.
Searching
Let’s first search for IPCA’s code:
In [1]: import pandas as pd

In [2]: pd.set_option('display.expand_frame_repr', False, 'display.max_colwidth', -1, 'display.max_rows', 10)

In [3]: from seriesbr import ibge

In [4]: ibge.search("Variação mensal, acumulada no ano, acumulada em 12 meses")
Out[4]:
     id                                                                                                                                                                                           nome pesquisa_id                                     pesquisa_nome
0  1100  INPC - Variação mensal, acumulada no ano, acumulada em 12 meses e peso mensal, para o índice geral, grupos, subgrupos, itens e subitens de produtos e serviços (a partir de janeiro/2012)      PC          Índice Nacional de Preços ao Consumidor
1  1419  IPCA - Variação mensal, acumulada no ano, acumulada em 12 meses e peso mensal, para o índice geral, grupos, subgrupos, itens e subitens de produtos e serviços (a partir de janeiro/2012)      IA          Índice Nacional de Preços ao Consumidor Amplo
2  1705  IPCA15 - Variação mensal, acumulada no ano, acumulada em 12 meses e peso mensal, para o índice geral, grupos, subgrupos, itens e subitens de produtos e serviços (a partir de fevereiro/2012)  IQ          Índice Nacional de Preços ao Consumidor Amplo 15
You could also search for a specific research (or any other column) in this way:
In [5]: ibge.search(pesquisa_nome="Índice Nacional de Preços ao Consumidor Amplo$")
Out[5]:
      id                                                                                                                                                                                       nome pesquisa_id                                  pesquisa_nome
0   656   IPCA - Peso mensal, para o índice geral, grupos, subgrupos, itens e subitens de produtos e serviços (de agosto/1999 até junho/2006)                                                        IA          Índice Nacional de Preços ao Consumidor Amplo
1   61    IPCA - Peso mensal, para o índice geral, grupos, subgrupos, itens e subitens de produtos e serviços (de janeiro/1991 até julho/1999)                                                       IA          Índice Nacional de Preços ao Consumidor Amplo
2   1693  IPCA - Peso mensal, para o índice geral, grupos, subgrupos, itens e subitens de produtos e serviços (de julho/1989 até dezembro/1990)                                                      IA          Índice Nacional de Preços ao Consumidor Amplo
3   6691  IPCA - Série histórica com número-índice, variação mensal e variações acumuladas a partir de 12 meses (a partir de novembro/2014)                                                          IA          Índice Nacional de Preços ao Consumidor Amplo
4   1737  IPCA - Série histórica com número-índice, variação mensal e variações acumuladas em 3 meses, em 6 meses, no ano e em 12 meses (a partir de dezembro/1979)                                  IA          Índice Nacional de Preços ao Consumidor Amplo
..   ...                                                                                                                                                        ...                                  ..                                                    ...
17  643   IPCA dessazonalizado - Variação acumulada no ano, para o índice geral, grupos, subgrupos, itens e subitens de produtos e serviços (de janeiro/1998 até julho/1999)                         IA          Índice Nacional de Preços ao Consumidor Amplo
18  1420  IPCA dessazonalizado - Variação mensal, acumulada no ano e peso mensal, para o índice geral, grupos, subgrupos, itens e subitens de produtos e serviços (a partir de janeiro/2012)         IA          Índice Nacional de Preços ao Consumidor Amplo
19  2942  IPCA dessazonalizado - Variação mensal, acumulada no ano e peso mensal, para o índice geral, grupos, subgrupos, itens e subitens de produtos e serviços (de julho/2006 até dezembro/2011)  IA          Índice Nacional de Preços ao Consumidor Amplo
20  661   IPCA dessazonalizado - Variação mensal, para o índice geral, grupos, subgrupos, itens e subitens de produtos e serviços (de agosto/1999 até junho/2006)                                    IA          Índice Nacional de Preços ao Consumidor Amplo
21  645   IPCA dessazonalizado - Variação mensal, para o índice geral, grupos, subgrupos, itens e subitens de produtos e serviços (de janeiro/1998 até julho/1999)                                   IA          Índice Nacional de Preços ao Consumidor Amplo

[22 rows x 4 columns]
In fact, you can search in a similar way within any column. Also notice that the string is a regex.
We want the aggregate that goes by the code 1419. So now let’s take a
look at the available variables with seriesbr.ibge.list_variables().
In [6]: ibge.list_variables(1419)
Out[6]:
     id                               variavel unidade
0  63    IPCA - Variação mensal                 %
1  69    IPCA - Variação acumulada no ano       %
2  2265  IPCA - Variação acumulada em 12 meses  %
3  66    IPCA - Peso mensal                     %
We will use all of them eventually, but it is good to know them if you want a specific one.
Now we need the codes of the same classifications used by IBGE in its
visualizations. We need seriesbr.ibge.list_classifications()
to search for that.
Because all list_* functions take an arbitrary number of regexes as
arguments to search in column nome, by default, we will search for
those which have a single number followed by a dot, letters or spaces.
This means they’re products’ major groups, not subgroups etc.
In [7]: categories = ibge.list_classifications(
   ...:     1419,
   ...:     "Índice geral",
   ...:     "^\d\.[A-z ]+",
   ...: )
   ...:

In [8]: categories
Out[8]:
     id                         nome unidade  nivel classificacao_id                      classificacao_nome
0  7169  Índice geral                 None   -1      315              Geral, grupo, subgrupo, item e subitem
1  7170  1.Alimentação e bebidas      None   -1      315              Geral, grupo, subgrupo, item e subitem
2  7445  2.Habitação                  None   -1      315              Geral, grupo, subgrupo, item e subitem
3  7486  3.Artigos de residência      None   -1      315              Geral, grupo, subgrupo, item e subitem
4  7558  4.Vestuário                  None   -1      315              Geral, grupo, subgrupo, item e subitem
5  7625  5.Transportes                None   -1      315              Geral, grupo, subgrupo, item e subitem
6  7660  6.Saúde e cuidados pessoais  None   -1      315              Geral, grupo, subgrupo, item e subitem
7  7712  7.Despesas pessoais          None   -1      315              Geral, grupo, subgrupo, item e subitem
8  7766  8.Educação                   None   -1      315              Geral, grupo, subgrupo, item e subitem
9  7786  9.Comunicação                None   -1      315              Geral, grupo, subgrupo, item e subitem
Apart from those, there are also list_periods
and list_locations.
Getting time series
Now let’s use all this information we’ve gathered and get the actual values
with seriesbr.ibge.get_series().
The aggregate is 1419, we will use every variable so no need to filter that.
Since we have the codes for classifications and categories, we can just
pass a dictionary like this: { classification: [ categories ] }.
But if you wanted data for all values of a classification, you don’t need to give a list of all categories’ codes, just pass the classification code alone as an int / str, or a list of them, and you’ll get all of its categories.
In [9]: ipca = ibge.get_series(1419, last_n=1, classifications={315: categories.id.to_list()})

In [10]: ipca
Out[10]:
           Brasil (Código) Variável (Código)                Variável Geral, grupo, subgrupo, item e subitem    Valor
Date
2019-11-01  1               63                IPCA - Variação mensal  Índice geral                           0.5100
2019-11-01  1               63                IPCA - Variação mensal  1.Alimentação e bebidas                0.7200
2019-11-01  1               63                IPCA - Variação mensal  2.Habitação                            0.7100
2019-11-01  1               63                IPCA - Variação mensal  3.Artigos de residência               -0.3600
2019-11-01  1               63                IPCA - Variação mensal  4.Vestuário                            0.3500
...        ..               ..                                   ...                      ...                   ...
2019-11-01  1               66                IPCA - Peso mensal      5.Transportes                          18.2107
2019-11-01  1               66                IPCA - Peso mensal      6.Saúde e cuidados pessoais            12.3191
2019-11-01  1               66                IPCA - Peso mensal      7.Despesas pessoais                    10.8783
2019-11-01  1               66                IPCA - Peso mensal      8.Educação                             5.0140
2019-11-01  1               66                IPCA - Peso mensal      9.Comunicação                          3.4393

[40 rows x 5 columns]
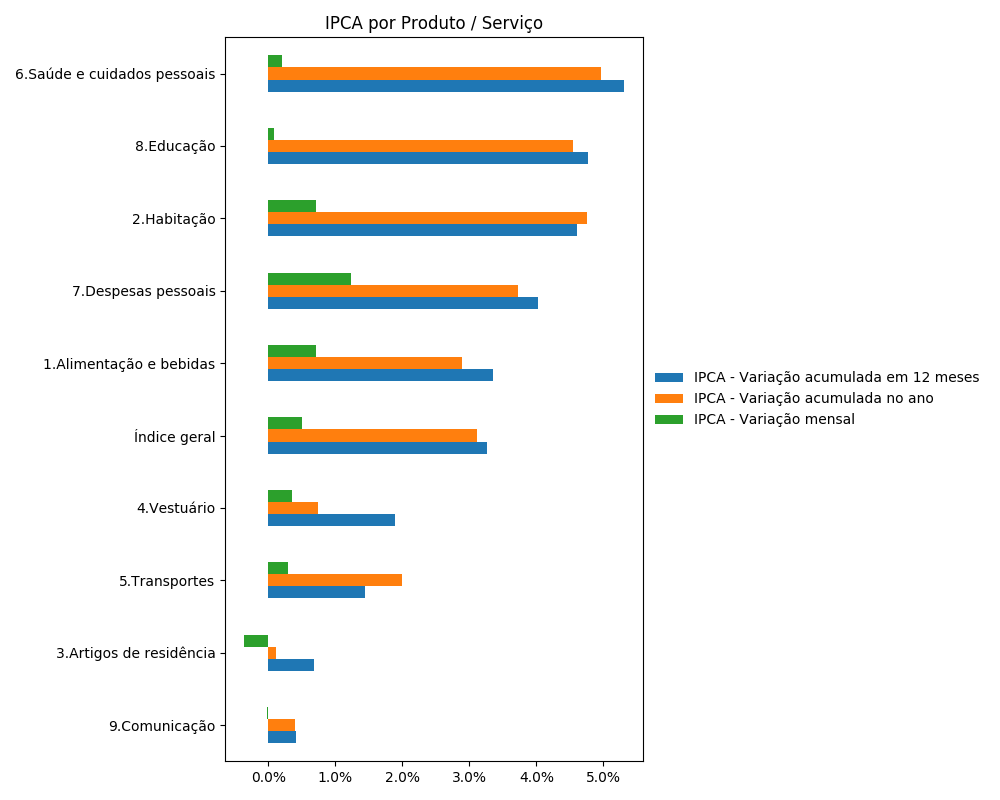
Now let’s visualize the inflation rate by product / service.
In [11]: import matplotlib

In [12]: import matplotlib.pyplot as plt

In [13]: import matplotlib.ticker as ticker

In [14]: ipca.pivot_table(
   ....:     index="Geral, grupo, subgrupo, item e subitem", columns="Variável", values="Valor"
   ....: ).drop("IPCA - Peso mensal", axis="columns").sort_values(
   ....:     "IPCA - Variação acumulada em 12 meses"
   ....: ).plot(
   ....:     kind="barh", title="IPCA por Produto / Serviço", figsize=(10, 8)
   ....: ).legend(
   ....:     bbox_to_anchor=(1, 0.5), loc="center left", frameon=False
   ....: )
   ....:
Out[14]: <matplotlib.legend.Legend at 0x7f9247d1eef0>

In [15]: plt.ylabel("");

In [16]: plt.tight_layout()

In [17]: plt.gca().xaxis.set_major_formatter(ticker.PercentFormatter())
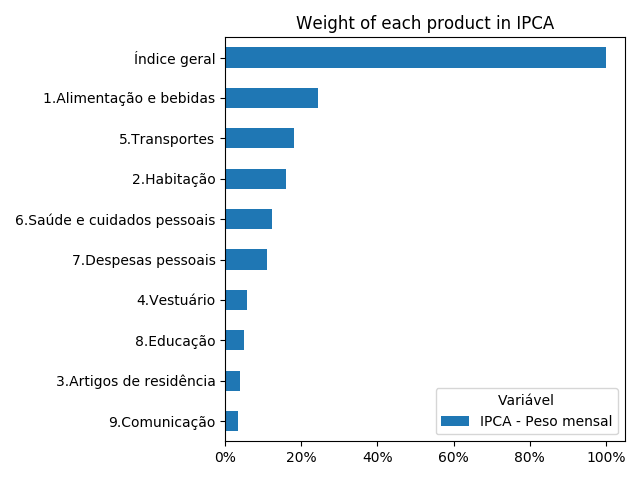
To see the weight of each product in the inflation rate:
In [18]: ipca.pivot_table(
   ....:     index="Geral, grupo, subgrupo, item e subitem", columns="Variável", values="Valor"
   ....: ).loc[:, ["IPCA - Peso mensal"]].sort_values("IPCA - Peso mensal").plot(
   ....:     kind="barh", title="Weight of each product in IPCA"
   ....: )
   ....:
Out[18]: <matplotlib.axes._subplots.AxesSubplot at 0x7f9247ae7978>

In [19]: plt.ylabel("");

In [20]: plt.tight_layout()

In [21]: plt.gca().xaxis.set_major_formatter(ticker.PercentFormatter())
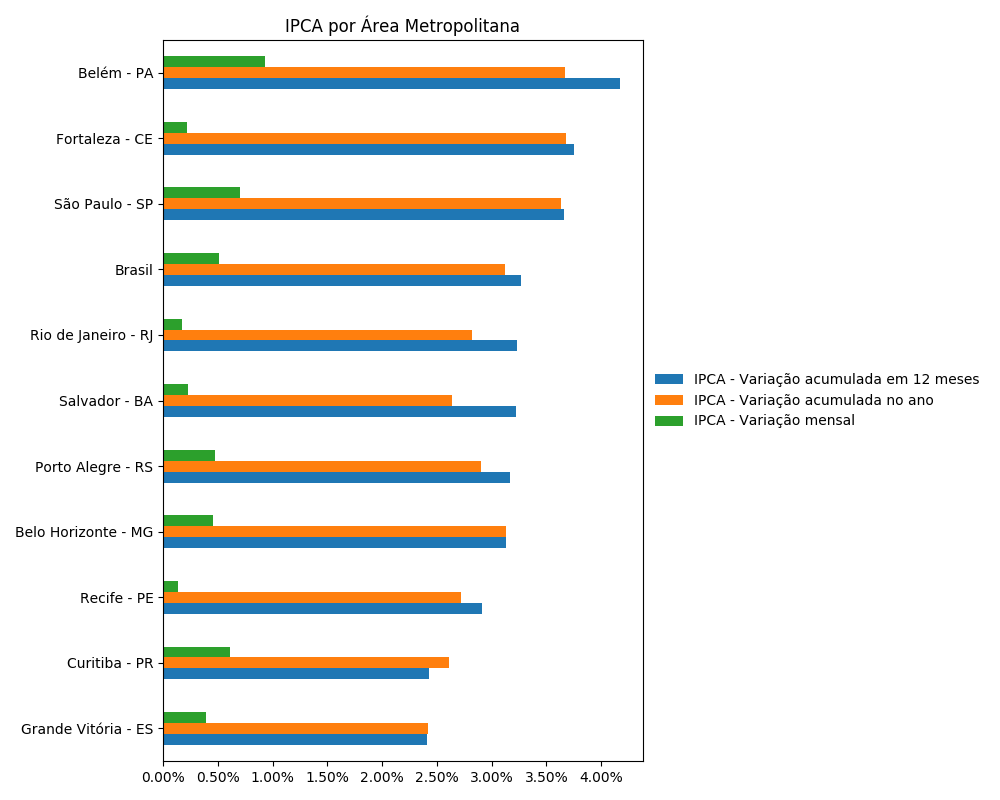
It would be great if we could plot the inflation rate by metropolitan area, a mesoregion, like they did.
But apart from mesoregions, there are also macroregions (Sul, Sudeste),
microregions (Baixadas, Norte Fluminense etc. in Rio de Janeiro), municipalities
and states, see the documentation for details.
Note
Since v0.1.3 arguments for locations are in plural, i.e., macroregions, municipalities, microregions, mesoregions and states.
If a given location is available for an aggregate, you can assign “all”
(actually anything that would be evaluated as True in Python) and it
will return data for every instance of that location, but you could also
pass a list or a single code to select specific locations.
By default, it will get data for the whole country. If you want data for other regions and also for Brazil as a whole, you can do the following:
In [22]: ipca_by_area = ibge.get_series(1419, mesoregions=True, brazil="yes", last_n=1)

In [23]: ipca_by_area
Out[23]:
           Região Metropolitana e Brasil (Código) Região Metropolitana e Brasil Variável (Código)                               Variável Geral, grupo, subgrupo, item e subitem   Valor
Date
2019-11-01  1501                                   Belém - PA                    63                IPCA - Variação mensal                 Índice geral                           0.93
2019-11-01  1501                                   Belém - PA                    69                IPCA - Variação acumulada no ano       Índice geral                           3.67
2019-11-01  1501                                   Belém - PA                    2265              IPCA - Variação acumulada em 12 meses  Índice geral                           4.17
2019-11-01  1501                                   Belém - PA                    66                IPCA - Peso mensal                     Índice geral                           100.00
2019-11-01  2301                                   Fortaleza - CE                63                IPCA - Variação mensal                 Índice geral                           0.22
...          ...                                          ...                    ..                               ...                              ...                              ...
2019-11-01  4301                                   Porto Alegre - RS             66                IPCA - Peso mensal                     Índice geral                           100.00
2019-11-01  1                                      Brasil                        63                IPCA - Variação mensal                 Índice geral                           0.51
2019-11-01  1                                      Brasil                        69                IPCA - Variação acumulada no ano       Índice geral                           3.12
2019-11-01  1                                      Brasil                        2265              IPCA - Variação acumulada em 12 meses  Índice geral                           3.27
2019-11-01  1                                      Brasil                        66                IPCA - Peso mensal                     Índice geral                           100.00

[44 rows x 6 columns]
In [24]: ipca_by_area.pivot_table(
   ....:     index="Região Metropolitana e Brasil", columns="Variável", values="Valor"
   ....: ).drop("IPCA - Peso mensal", axis="columns").sort_values(
   ....:     "IPCA - Variação acumulada em 12 meses"
   ....: ).plot.barh(
   ....:     title="IPCA por Área Metropolitana", figsize=(10, 8)
   ....: ).legend(
   ....:     bbox_to_anchor=(1, 0.5), loc="center left", frameon=False
   ....: )
   ....:
Out[24]: <matplotlib.legend.Legend at 0x7f9247de3ac8>

In [25]: plt.ylabel("");

In [26]: plt.tight_layout()

In [27]: plt.gca().xaxis.set_major_formatter(ticker.PercentFormatter())
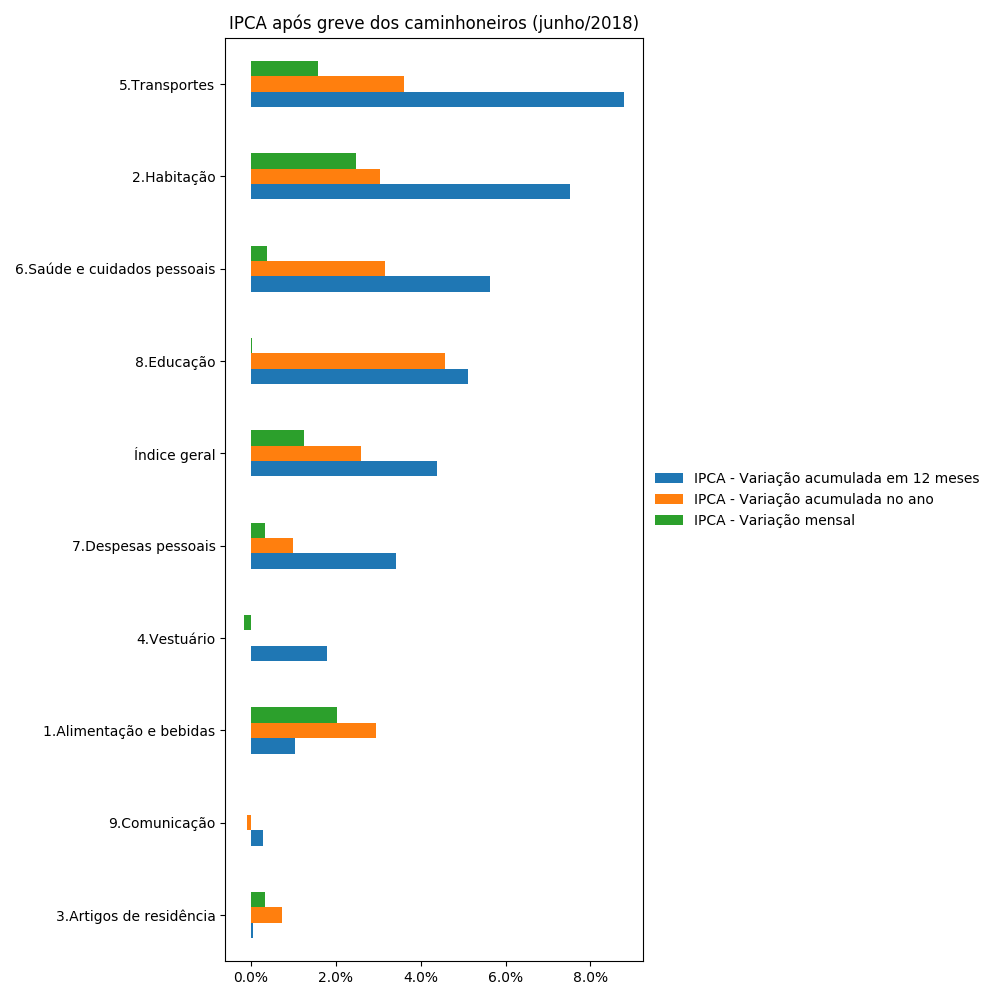
You could, of course, also filter by a specific date. For example, it may be be interesting to know the inflation by product soon after the Truck Drivers’ strike in 2018.
In [28]: ibge.get_series(
   ....:     1419,
   ....:     classifications={315: categories.id.to_list()},
   ....:     start="jun-2018",
   ....:     end="jun-2018",
   ....: ).pivot_table(
   ....:     index="Geral, grupo, subgrupo, item e subitem", columns="Variável", values="Valor"
   ....: ).drop(
   ....:     "IPCA - Peso mensal", axis="columns"
   ....: ).sort_values(
   ....:     "IPCA - Variação acumulada em 12 meses"
   ....: ).plot.barh(
   ....:     title="IPCA após greve dos caminhoneiros (junho/2018)", figsize=(10, 10)
   ....: ).legend(
   ....:     bbox_to_anchor=(1, .5), loc="center left", frameon=False
   ....: )
   ....:
Out[28]: <matplotlib.legend.Legend at 0x7f92446a3eb8>

In [29]: plt.ylabel("");

In [30]: plt.tight_layout()

In [31]: plt.gca().xaxis.set_major_formatter(ticker.PercentFormatter())
Getting metadata
To get metadata of a time series:
In [32]: ibge.get_metadata(1419).head()
Out[32]:
                                                                                                                                                                                             values
id        1419
nome      IPCA - Variação mensal, acumulada no ano, acumulada em 12 meses e peso mensal, para o índice geral, grupos, subgrupos, itens e subitens de produtos e serviços (a partir de janeiro/2012)
URL       http://sidra.ibge.gov.br/tabela/1419
pesquisa  Índice Nacional de Preços ao Consumidor Amplo
assunto   Índices de preços